
If we, humans, are so time-bound, then you would think that by every new time period like hour, day or month, something different would start to happen. In this article we will be digging into the opposite. The end period! You would expect that we as a whole, won’t start new things on 14:50 (better 15:00 exactly?) or on Friday! So the hypothesis we will be formulating today is that on Friday- new trends don’t happen. More specifically, if there was a strong trend before Friday, then on Friday it is not going to change.
In the last article we have discussed some clues about the markets- Mondays are the range days, Wednesdays are reversals, Thursdays give us large movements. Today we will build upon Thursday. If Thursday gives us a big day either up or down, then what can we expect from Friday? Can we just go the same direction? This is simple enough to construct a backtest in google sheets and see how this strategy would have performed. [ Backtesting is a process for seeing how well a strategy would have performed in the past ]. We will be using the Yahoo SPY daily prices dataset since 1993. For the software, we will use google sheets.
Some variables that I will be using:
- Trend: A simple formula of =1-(Open/Close) gives us how much and to what direction market moved and closed that day
- Standard Deviation from mean: we first calculate the average of Trend (=AVERAGE()), then we calculate the standard deviation of the whole dataset (=STDEV()) and lastly, we calculate the distance =((Trend-Mean)/St. Deviation)
- We put them into intervals of 0.2 St. Deviations with formula =(Round(5*distance,0)/5)
After all these are done, we can use a =COUNTIF(interval, Friday) function to put all into a distribution table. We find that its average interval is -0.2. That means we can expect Friday to return a little less than a mean, which is 0.66%.
However, as we have mentioned in the beginning, we seek to prove that Friday does not change the direction if there was a strong trend prior. Let’s make a new column and write a simple formula which just checks if the last day was Thursday and if it’s distance from the mean is positive. (Essentially saying if Thursday closed above 0.66%, then…). See formula at Fig. 2 – Strong Thursday Formula
After all these are done, we can use a =COUNTIF(interval, Friday) function to put all into a distribution table. We find that its average interval is -0.2. That means we can expect Friday to return a little less than a mean, which is 0.66%.
However, as we have mentioned in the beginning, we seek to prove that Friday does not change the direction if there was a strong trend prior. Let’s make a new column and write a simple formula which just checks if the last day was Thursday and if it’s distance from the mean is positive. (Essentially saying if Thursday closed above 0.66%, then…). See formula at Fig. 1

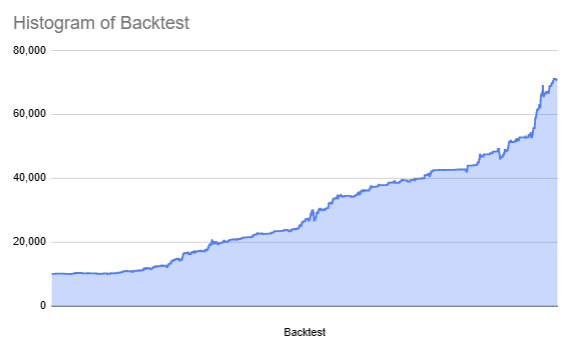
Taking an average of the H column gives us a value of 0.26 as opposed to -0.02. That means- there is a positive relationship between a trend on Thursday. Difference is almost three intervals on average, which is quite significant. Next obvious step is to create a simple backtest to see how often it is correct and to what degree. Additionally, draw a chart showcasing how the strategy would have performed. The formula for the backtest is a little more complicated for the google sheets. See Fig. 3 – Backtest Formula.

The formula is doing a couple of things:
- First, it’s checking if Thursday had a significant trend (More than the average)
- Secondly, it’s checking whether to Buy or to Sell (if E6 of last day is negative, then short, else buy)
- Thirdly, it’s calculating the result and multiplying it with the backtest value above
- Fourthly, if Thursday was not strong, we do nothing. Take the backtest value from above

That looks pretty good. So if Thursday is a big day, then on Thursday on 15:59 go along the trend, sell on Friday 15:59 and this should be a legit strategy. Of course, this backtest has no reality modelling as it’s out of scope of this article (will be done in later articles).
We can calculate some basic statistics and there are a couple things that stand out.
- The average loss (-1.04%) is larger than the average win (0.81). This is interesting as ideally speaking, we should be able to control the loss with clever stop losses. In the stage of optimization, we will seek to do just that.
- Its win rate is almost 76%, meaning an absolute majority of trades are winning.
Conclusion
With this article we have shown that there is a solid relationship between human psychology and the market, in particular- not starting new things on Friday!
Leave a Reply